
Recap of Part 1
In the previous article, we discussed, Prediction of sales from historical time series data. How outlier detection IQR (Interquartile range) technique improve the accuracy of daily sales and monthly sales prediction values ( Check out Part I of this article ). here we are going to discuss how the same (IQR) technique influences the individual product sales prediction.
Understand monthly sales data for the product: “Music videos”
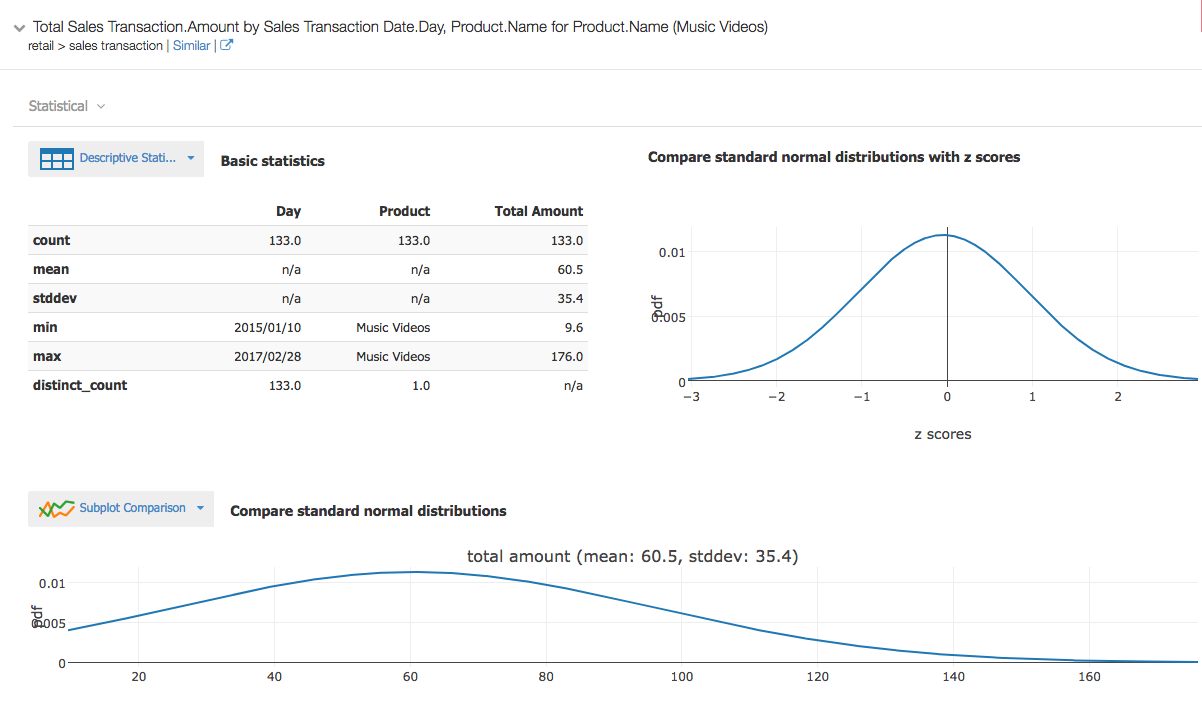
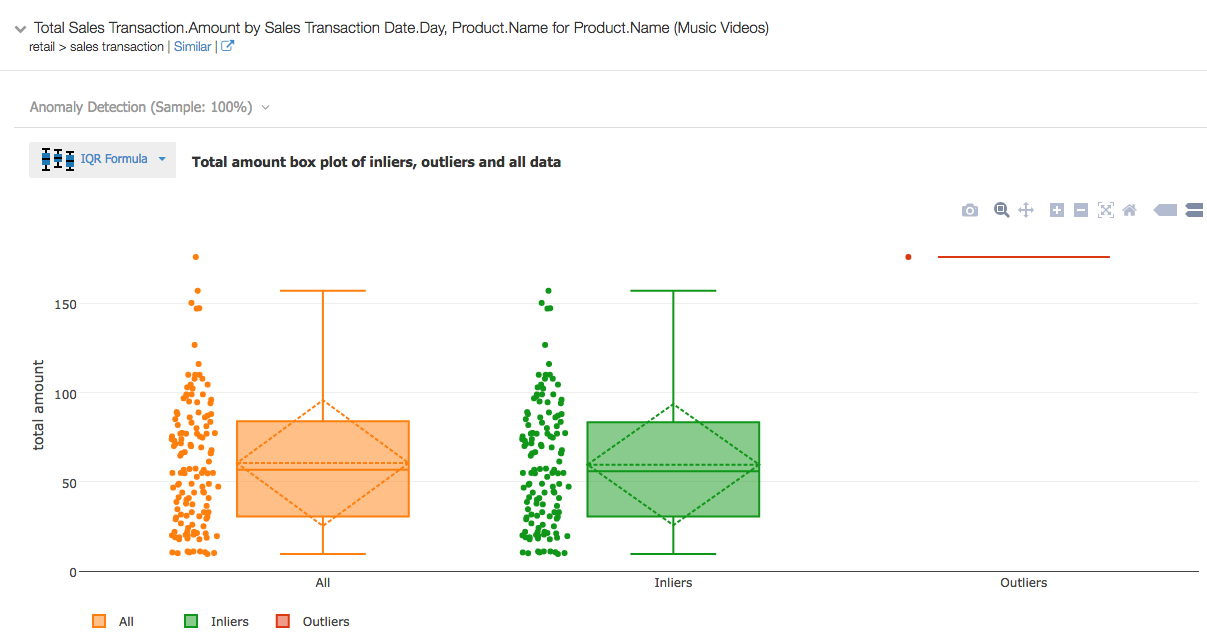
Statistics of daily sales of Product: music videos. mean value of daily sales amount is 60.5 From standard normal distribution some of daily sales amount up to $160! Screen Shot 2017-07-19 at 4.42.03 PM
z-scores
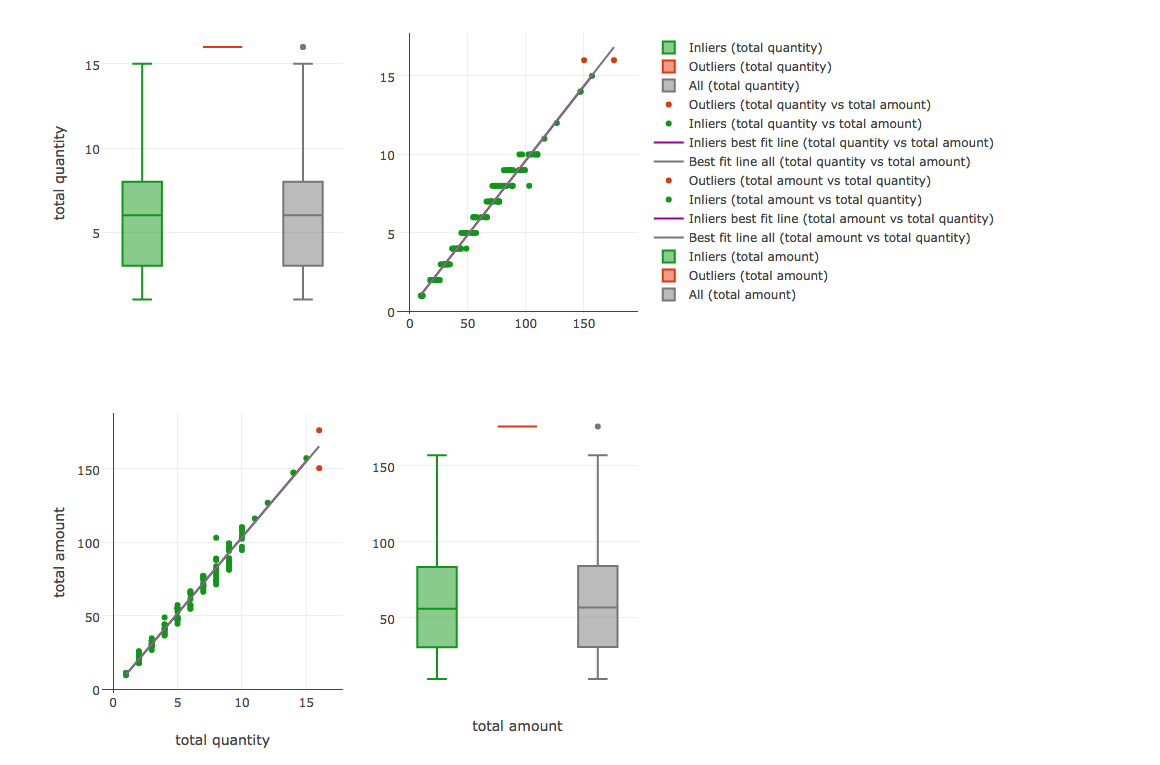
Standardization or z-scores is the most commonly used method. It converts all indicators to a common scale with an average of zero and standard deviation of one. Comparing daily sales quantity with sales amount of producing music videos, gives the idea of how the data is distributed in common scale. 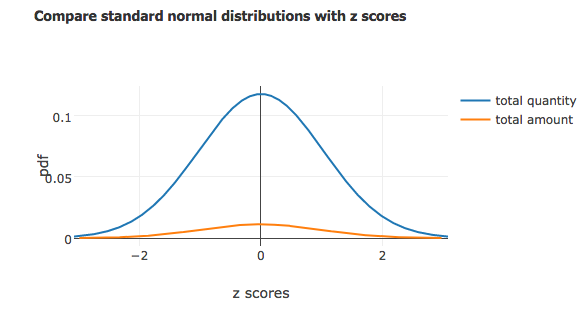
Normal distribution
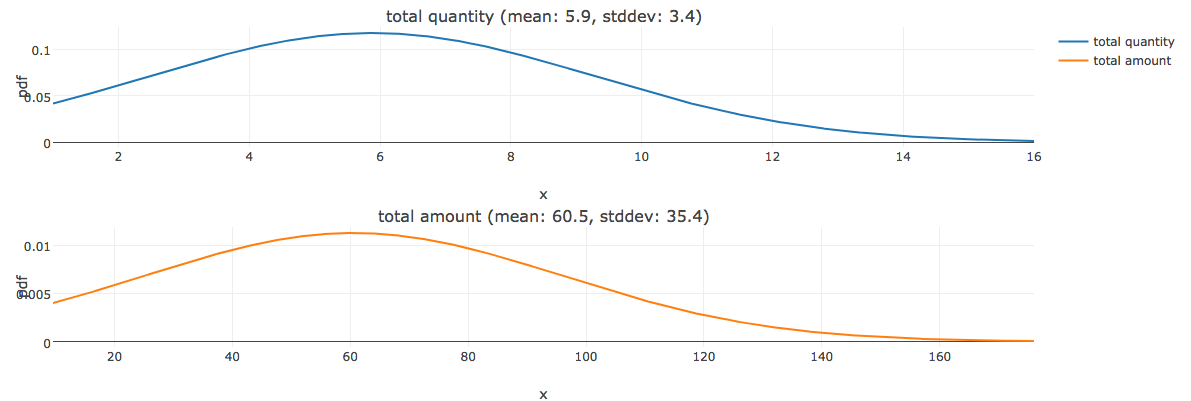 Here we can see the same ( above said ) comparison with their own scales respectively daily sales quantity and amount. most of the daily sales amount lies between $30 to $100. rarely it reaches $160 and above.
Outliers not visible in time series data
From the daily music video sales amount data, there is no standard growth or downfalls, only the irregular patterns are visible. 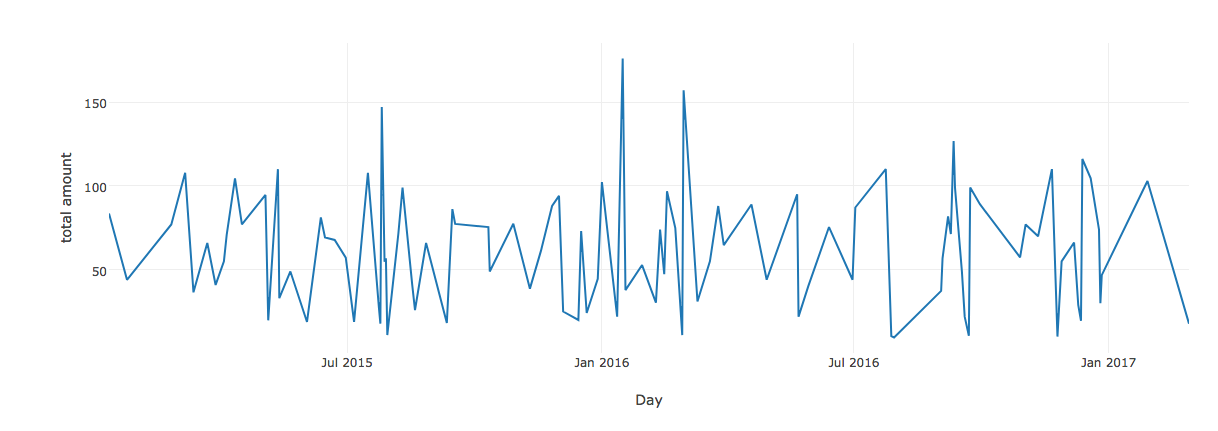

Detect outliers using IQR formula
Detection of outliers combining sales quantity and amount
Compare sales predictions
Product Name Daily sales Prediction
With Outliers (Actual data) After removing outliers
Music videos $62 $59
Entertainment Laptops $2905 $2850
Android Phones $1113 $1022
Music videos $490 $530
cross validation of current prediction
Plotting daily cumulative sales value (blue line) and after removing outliers (red line) 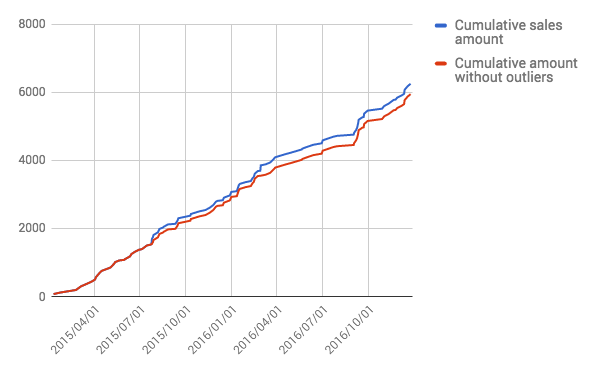 How does it change in daily sales prediction for the product Music videos. We can see the gap between normal prediction( blue line) and prediction after removing outlier data points (red line).
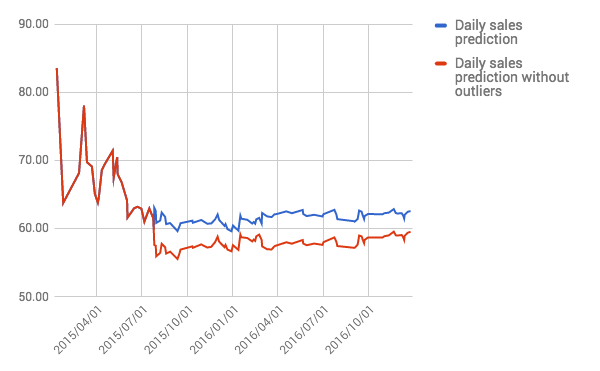
Conclusion
IQR technique helps to identify outlier data points, from single measure with time series and dimension attribute. furthermore, if we have multiple measure data sets, we need more advanced algorithm like One-class SVM, Robust covariance and Isolation forest. In further posts, we will discuss more.