
What is abnormality :
A sale of any product that does not represent a normal market sales transaction. for example, a store sells 100 units of product A in a month, on the same time frame other stores are selling only 20 units, then the first store would be considered as an abnormal sale.
Business scenario :
One of the product ( say Smart watch) sold across many stores. There will be difference of sales, that is some of the stores always sell more. some of them sells less. If we check the same with in a monthly time frame, in some of the months less selling stores may sell more than top selling stores.
Detecting abnormality :
overall Product ( smart watch ) Sales by stores 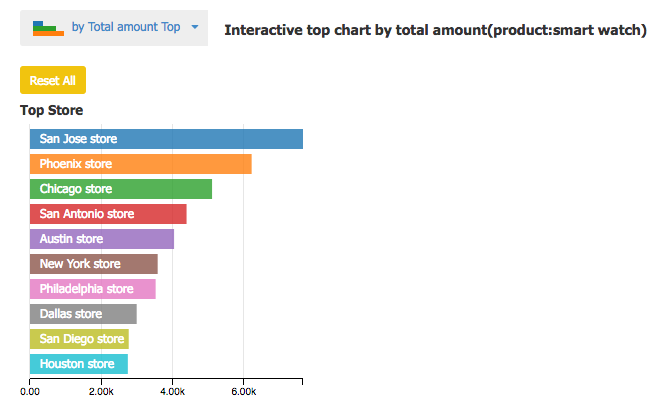
Hypothesis
1. San Jose store is selling more smartwatches compared to any other stores each month
- San Jose store sales <= other stores sales (Null Hypothesis)
- San Jose store sales > other stores sales (Alternative Hypothesis) 2. San Jose store is selling smartwatches at least 2 times more than Houston store each month
- San Jose Store sales >= 2 times Houston store sales (Null Hypothesis)
- San Jose Store sales < 2 times Houston store sales (Alternative Hypothesis)
Heat map of month vs stores by product (smartwatch ) sales
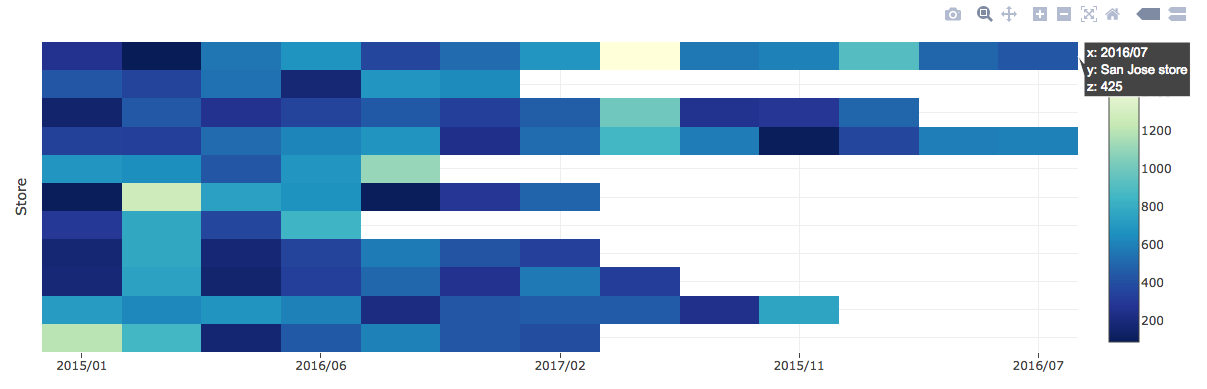
- from the above heat map San Jose store is most of the time sells better than any other stores but not always. (Alternative Hypothesis)
Monthly sales of product ( smart watch) by San Jose store vs Houston store
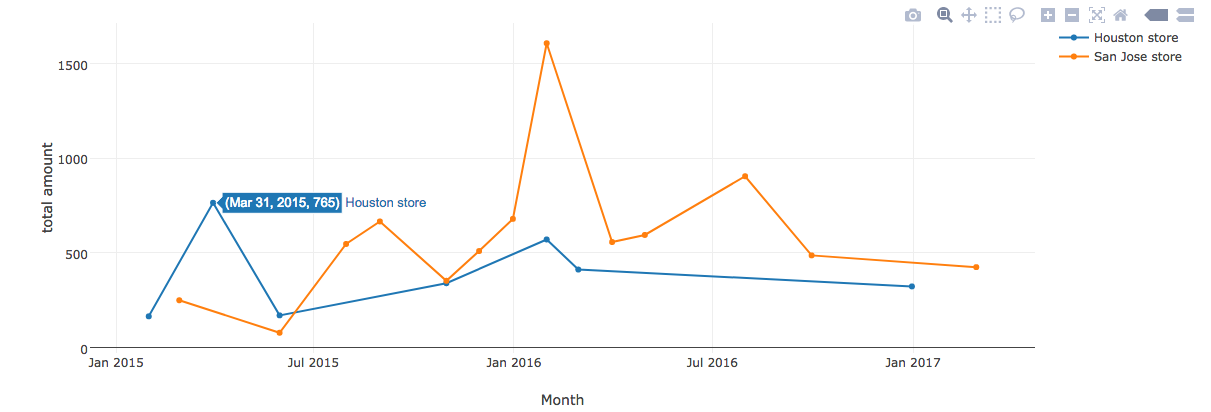 From above analysis we can see
- some of the months San Jose store sales of product smart watch is less than Houston store (Alternative Hypothesis)
Lets see the how various anomaly detection algorithms finding this anomalies ( of sales amount & sales quantity) respectively one class SVM, Robust covariance and Isolation forest. Monthly sales amount and quantity of product Smart watch across 11 stores.
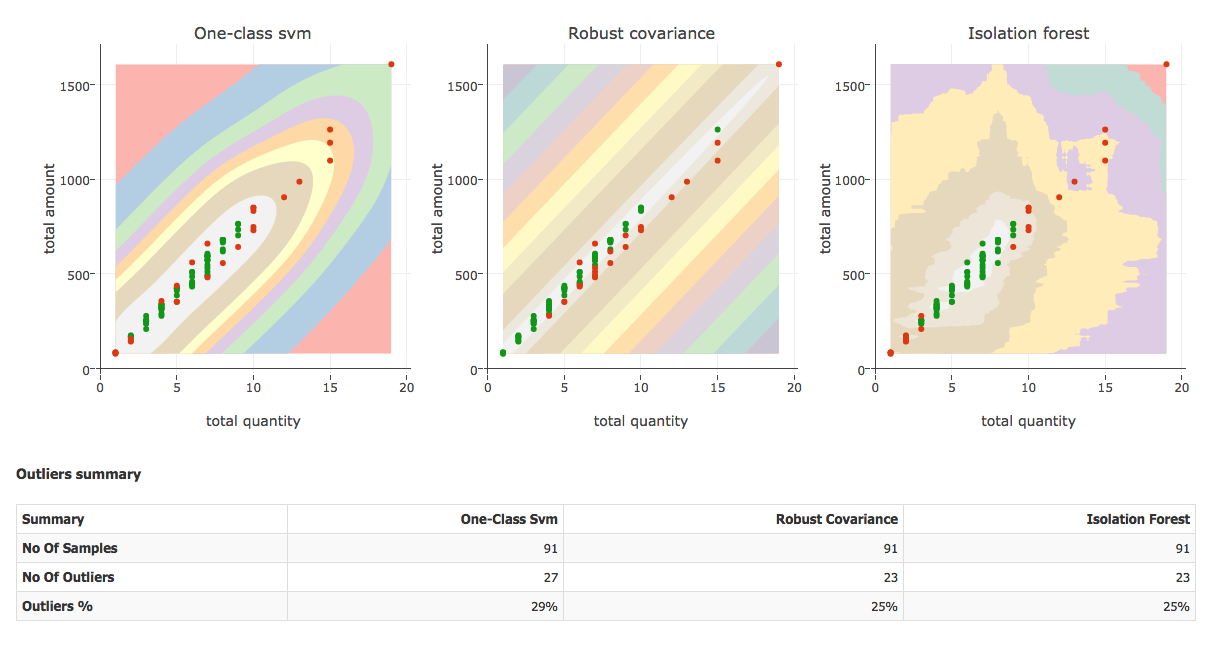 One class SVM detects 27 outliers from this event out of 91. robust covariance detects 23 out of 91 but it shows some of the low value points as normal one ( green dots). as per Isolation forest, low value and high value data points are detected as outliers.
Final notes
In coming articles we will discuss more about anomaly detection algorithms one by one.