Products
Platform
DWS
D3K
DPMS
API
Event Tickets Search API
E-commerce search API
Data Search API
Services
Analytics AI
DevOps Automation
Cloud migration
Tools
urAI - Annotation Tool
Business Function
Sales Analytics AI
Marketing Analytics AI
CRM Analytics AI
Financial Analytics AI
Human Resource Analytics AI
Production Analytics AI
Operations Analytics AI
Supply Chain Analytics AI
R&D Analytics AI
Industry Specific
Retail e-Commerce Analytics AI
Automotive Analytics AI
Banking & Finance Analytics AI
Consumer Products Analytics AI
Health Care Analytics AI
Education Analytics AI
High Tech Analytics AI
Insurance Analytics AI
Media Analytics AI
Oil & Gas Analytics AI
Sports & Ent Analytics AI
Telecommunication Analytics AI
IoT Analytics AI
Data & Security Analytics AI
Transportation Analytics AI
Manufacturing Analytics AI
Solutions
By Business Type
Small Business
Startups
By Need
Data Driven Decisions
Artificial intelligence
AI Insights
Chatbot implementation
AI Data encryption
Cloud migration
By Business Function
Sales
Marketing
CRM
Financial
Human Resource
Production
Operations
Supply Chain
R&D
By Industry
Retail e-Commerce
Automotive
Banking & Finance
Consumer Products
Health Care
Education
High Tech
Insurance
Media
Oil & Gas
Sports & Entertainment
Telecommunication
Internet Of Things (IOT)
Data & Security
Transportation
Manufacturing
Support
Blog
User guide
Resources
Api docs
Release Notes
Contact support
Login
Try it for free
Home
»
Analytics AI
»
User guide
»
DWS
»
Visualization
»
Interactive time with Measures
User guide
Getting started
DWS
Create DWS project
Search
Analysis
Visualization
Pie chart
Bar chart
Horizontal bar chart
Line chart
Text word cloud chart
Box plot
Heat map
Time Series Chart
Vertical Grouped Bar Chart
Horizontal Multi Bar Chart
Multi Line Chart
Stacked Area Chart
Table with inline Bar Graph
Interactive Bubble Chart
Top N Horizontal Bar Chart
Sub Plot - Measure wise Line Chart
Sub Plot - Measure wise Bar Chart
Sub Plot - Measure & Attribute wise Line Chart
Scatter Plot
3D Scatter Plot
Scatter Matrix Plot
Parallel Coordinates Plot
Interactive time with Measures
Scatter Bubble Map (USA)
Subplot - Scatter Bubble Map (USA)
State Wise Interactive Map (USA)
Subplot Multi Bar Chart
State Wise Interactive Map (USA) with 3 Attributes
Subplot - Msr wise Scatter Bubble Map (USA)
Boards
D3K
DPMS
Connections
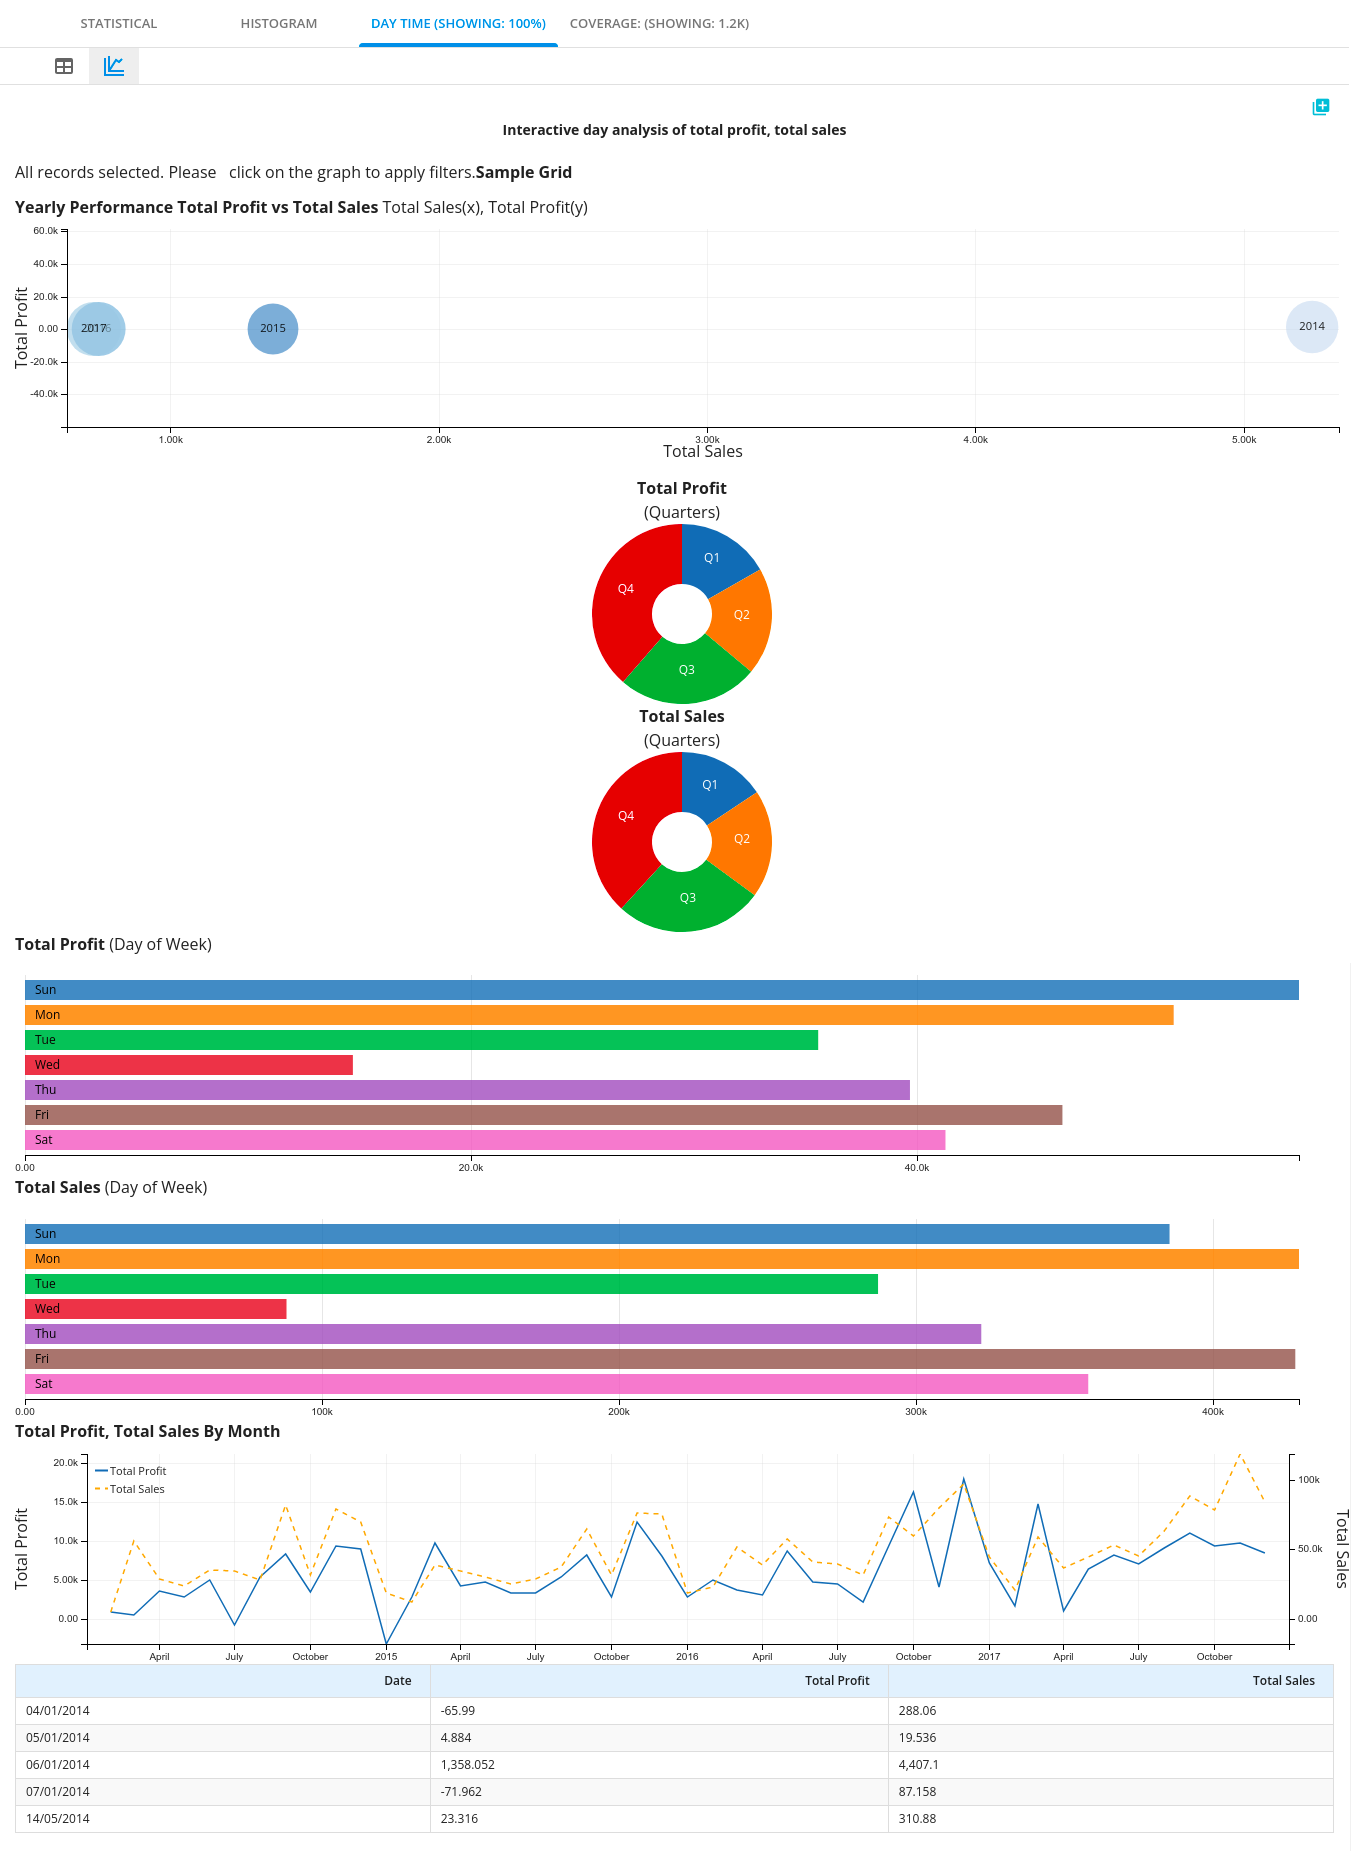
Interactive time Analysis with Measures
This chart option is visible only if
Search term with two measures, one attribute and one time attribute
Number of attribute (rows) must be greater than or equal to 10